March 2024
Analytics
Spectral Analysis
The Spectrum Analysis page on the TRACTIAN platform has undergone a complete overhaul to meet the demands of vibration specialists. Now, the spectra feature visual improvements, and the analysis tools have been enhanced, offering users a more technical, precise, and detailed approach.

Harmonic Series
Selector Automatically highlight a harmonic series from the selection of the fundamental frequency to analyze the alignment of the peaks.

Waterfall Plot Analysis
It is now possible to compare spectrum from different periods through a waterfall plot view, allowing a detailed analysis of the evolution of faults over time. This visualization highlights changes in vibration patterns and frequency spectrum, facilitating the identification of emerging trends or worsening of existing conditions.

Failure Frequency Highlighting
This highlights the failure frequencies using data from the equipment's Technical Sheets. This update enhances spectral analysis, allowing for the quick identification of anomalies and facilitating early diagnosis based on precise technical information.

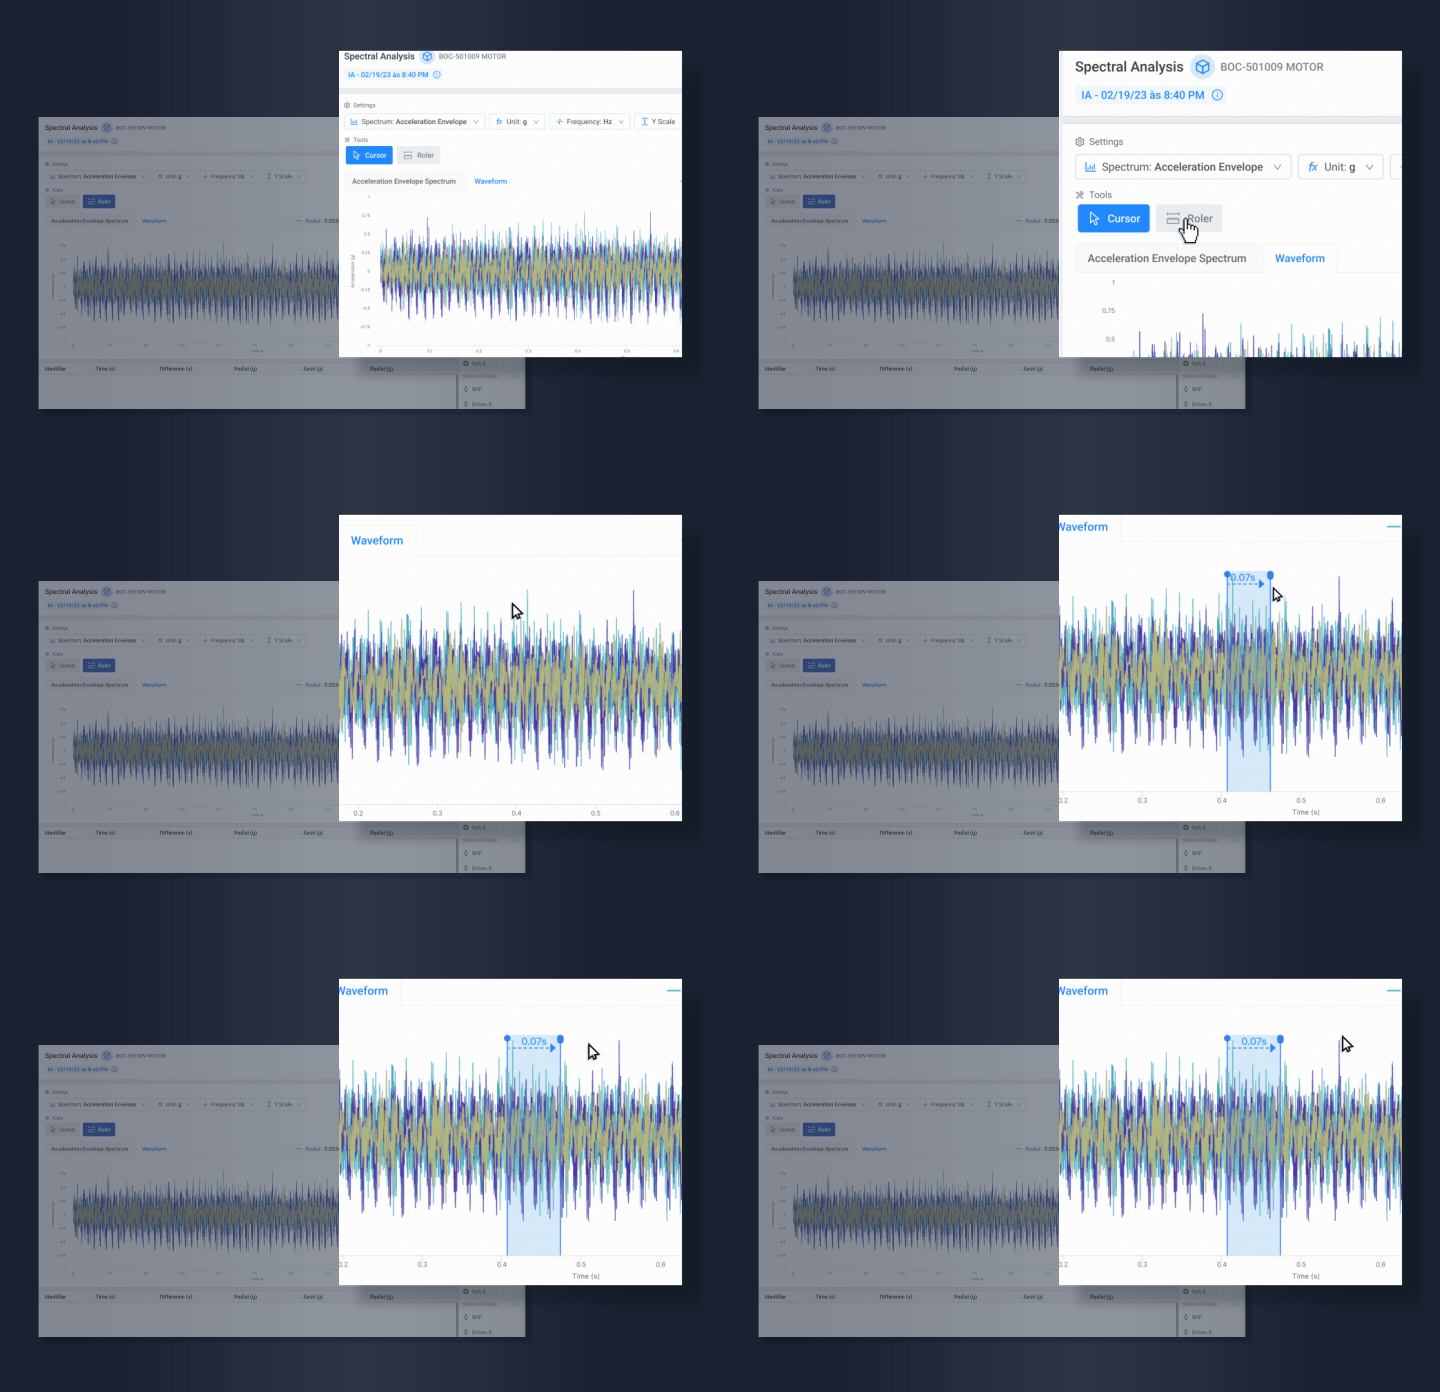
Ruler: Measurement Between Peaks
Measuring Between Peaks Measure the distance between frequencies in the spectrum or peaks in the waveform directly on the TRACTIAN platform. This functionality enhances the analysis, allowing for the identification of periodic patterns in temporal analyses, crucial for detecting regularities or anomalies in the vibration data of the equipment.

With the new tools implemented, we have significantly elevated failure analysis and asset monitoring. These improvements have the potential to transform how data is interpreted, providing deeper and more accurate insights. If you want to know the step-by-step processes or have any questions clarified, we have updated our FAQ to give you all the necessary support.
Link copied to desktop!